Documentation
Technical writeup of the NBA playoff prediction model.
Introduction
I've been following the NBA for about 6 years now and besides thoroughly enjoying the sensational basketball moments that NBA playoffs can produce, I am also really interested in the extensive statistics and numbers that accompany them. For a while now, I have been toying with the idea of building a model that predicts teams' NBA championship probabilities in a given year. This year, I finally got around to realizing my idea. In the end, I settled on using a logit model (binary dependent variable, fitted on historical playoff series) to predict single playoff series outcomes and simulating the knock-out structure of the playoffs using Monte Carlo simulation (50k simulations per playoffs). Finally, I built a dashboard to visualize all the results and let you play around with different years and training windows.
Given that the NBA playoffs are right around the corner, I am excited to present to you the results of my model, according to which the 2026 NBA Champion will be…
The Oklahoma City Thunder!
Of course these results are to be taken with a grain of salt, given the high variance and unpredictability that are inherent to NBA playoffs. Below I explain everything in detail including a results section describing the model outcomes in more detail. So prepare for a long read!
Model Explanation
As mentioned before, I applied a logistic regression (logit) model on playoff series level. A logit model is a model that assigns coefficients (basically weights) to chosen features (explanatory variables such as team net rating) that best explain the corresponding prediction variable (probability of winning a playoff series). The weights are fitted based on historical data. The aim is to use these assigned weights to predict playoff series outcomes in the 2026 playoffs using the feature values corresponding to the 2026 season. In this case we aim to predict the probability that the high seed wins. To include both high and low seed data in a single equation, the feature values are actually deltas. Hence, the final feature values used in the model are the differences in feature values between the high and low seed in a specific series. Using the logit model to predict series-level outcomes, I then applied Monte Carlo simulation to simulate the knock-out structure of the playoffs. Starting with the first round brackets based on regular season seeds, the 2026 playoffs were simulated 50,000 times.
To be able to construct this model and perform the simulations, I gathered historical data (1980–2024) containing playoff series information and team/player regular season data from various sources. I then built the dataset containing all raw feature values for each team/player in each historical year and the outcomes of all playoff series in that year.
The raw input data set contains a long list of potential features that are meant to capture the main components that (I believe) contribute to playoff success. The aspects I considered were:
- Team strength/characteristics — reg. season wins, net rating, offensive/defensive rating, TS%, eFG% etc.
- Star player(s) strength — player BPM, EPM, RAPTOR, superstar flag (to capture transcendent superstar impact)
- Star player(s) availability — historical playoff availability
- Roster playoff experience — cumulative playoff series played, series won
- Coach success — cumulative playoff series won, playoff win percentage
- Referee bias — FTA/FGA, FTA/2PA
- Homecourt advantage — implicitly captured in the intercept (to prevent collinearity)
- Matchup dependent features — pace, (O)REB rate, 3PA
A final note on players' playoff availability. Due to the unpredictable nature of injuries and their enormous impact on playoff series outcomes, I have used actual playoff series availability as a feature in the model. Historically (in-sample) this works because the information is known, however, using this feature would be impossible when using the model for predictions given that actual future availability is logically not known yet before a series starts (at least injuries occurring during a series). To remediate this and be able to capture the impact of injuries on outcomes, I constructed an injury prediction module. For each simulation (50k total), a uniform random number (0–1) is drawn using the player's historical playoff availability as the baseline parameter (capped at 0.99); if the random number for a player in a series exceeds the historical playoff availability percentage, the player does not play that series, else the player is healthy and plays that series. While far from perfect, the aim is that this more accurately captures the effect of injuries in the simulations and thus in final championship probabilities. For 2026, I also incorporated injuries known at the start of the playoffs to more accurately include injury impact in the model's predictions. For example, Luka is expected to miss most of the first round, which is incorporated in the injury simulations.
Model Selection & Specification
I started by defining three different training windows:
- Full (1980–2024)
- Modern (2000–2024)
- Recent (2014–2024)
These windows were chosen based on a mix of eras in the NBA and quality/granularity of available data. From 1980 onwards, reliable NBA data exists online, hence this was the hard cutoff for my full training dataset. From 2000 onward, more granular player metrics are available, such as EPM. Hence the shorter "modern" training window was meant to reflect these data changes. The "recent" window (2014–2024) was meant to capture the three point revolution and see the impact of this era shift on model coefficients compared to the other windows.
The model selection process consisted of running a full combinatorial search based on 2–6 feature models from a list of 23 features and selecting the top 5 models per training window based on 4 different statistical performance metrics:
- BIC — main metric given that it penalizes additional features (to prevent overfitting)
- AUC
- Brier Score
- Pseudo R²
Comparing the results over training windows and performance metrics, taking into account (statistical) significance of features, allowed me to distill which features consistently topped the leaderboards (and thus likely provide a significant predictive signal) and which features are less stable. The BIC metric generally favored a 3-feature model for all windows. The three features that were always amongst the highest ranking models, and therefore were selected in the final model, were the following:
| Feature | Description |
|---|---|
| delta_sum_bpm_avail | Delta between high and low seed of availability weighted BPM of top 3 players per team |
| delta_playoff_series_win | Delta between high and low seed of total playoff series wins per roster |
| delta_ts_percent | Delta between high and low seed of team True Shooting percentage |
Model Performance
In-Sample
The chosen model correctly predicts the outcome of roughly 80% of all historical playoff series (in-sample fit) for all three training windows and additionally correctly predicts around 32–36% of championships (assigns the highest championship probabilities to the actual champion). This seems low, but is more or less aligned with a 80% accuracy on series level (because 0.8⁴ ≈ 0.4). Generally, the championship favorite according to the model has a championship win probability anywhere between 30% and 50%, meaning that although they have the highest overall chance of winning the title, more times than not they will not actually win the championship. This also makes it notoriously difficult to correctly predict the final champion.
Additionally, the model does not capture all signals that predict series outcomes. This is partly because only 3 features were used in the chosen model. This was, however, a conscious choice, both to prevent overfitting given the relatively small training dataset and due to the high correlation between several features. The choice of number of features is always difficult due to the inherent tradeoff between model flexibility and explanatory power. Given two teams that are exactly equal (all deltas equal to zero), the model will assign the higher seed a 74.1% chance of winning the series due to the intercept being positive and rather large (1.05 in modern window). Part of this can be attributed to home court advantage which is captured in the intercept, but part is also missing features or simply unexplained variance or noise. A good example of this is the 1995 Houston Rockets, who were the #6 seed in the west and only had a 0.1% chance of winning the title according to the model, largely because they had no home-court advantage during any of their series and were always the lower seed, but did end up taking home the title of course.
I tried to at least reduce the large impact of seeding by exploring models with a larger number of features or even forcing the model to omit the intercept entirely but all these options performed significantly worse statistically speaking and did not visually improve predictions. Hence the chosen model prevailed.
Lastly, the logit model does also provide a direct win probability outcome of a head-to-head matchup between two teams in a series. Note that although team A might be stronger than team B in a direct matchup, its championship probability may still be lower if team B had an easier path to the finals, thereby facing lower odds of an upset along the way. This can for example be seen in 2023 (modern training window) when Denver has the higher championship probability due to their relatively easy path to the finals, but in a direct matchup the odds are 64/36 in favor of Milwaukee. The dashboard shows this in more detail and allows you to switch between matchup probabilities and championship probabilities.
Out-of-Sample
Lastly, the chosen model was used to predict the out-of-sample year 2025 (for validation). All three windows correctly predicted OKC to win the title in 2025 (granted not the most difficult year to predict). The full and modern window gave OKC ~40% chance of winning the title; in the recent window this dropped to 33% (the recent window has a slightly lower intercept than the other two, thus it weights the dominant regular season of OKC slightly less). Additionally, the full and modern windows assigned the second and third place to the Cavs and Celtics respectively. In the recent window the Celtics drop out of the top three and the Lakers take their place.
Calibration
Admittedly, the model is not very good at discrimination, i.e. accurately predicting upsets on a single series level. The below confusion matrix (based on modern training window) shows this clearly, where the number of predicted upsets is much smaller than the number of actually occurred upsets.
| Prediction: High Seed | Prediction: Upset | |
|---|---|---|
| Actual: High Seed | 292 | 6 |
| Actual: Upset | 69 | 8 |
The strength of this model actually lies in the accuracy of its predicted probabilities compared to actual win rates rather than predicting specific outcomes correctly. I have tested the calibration of the model and displayed the results in the figure below.
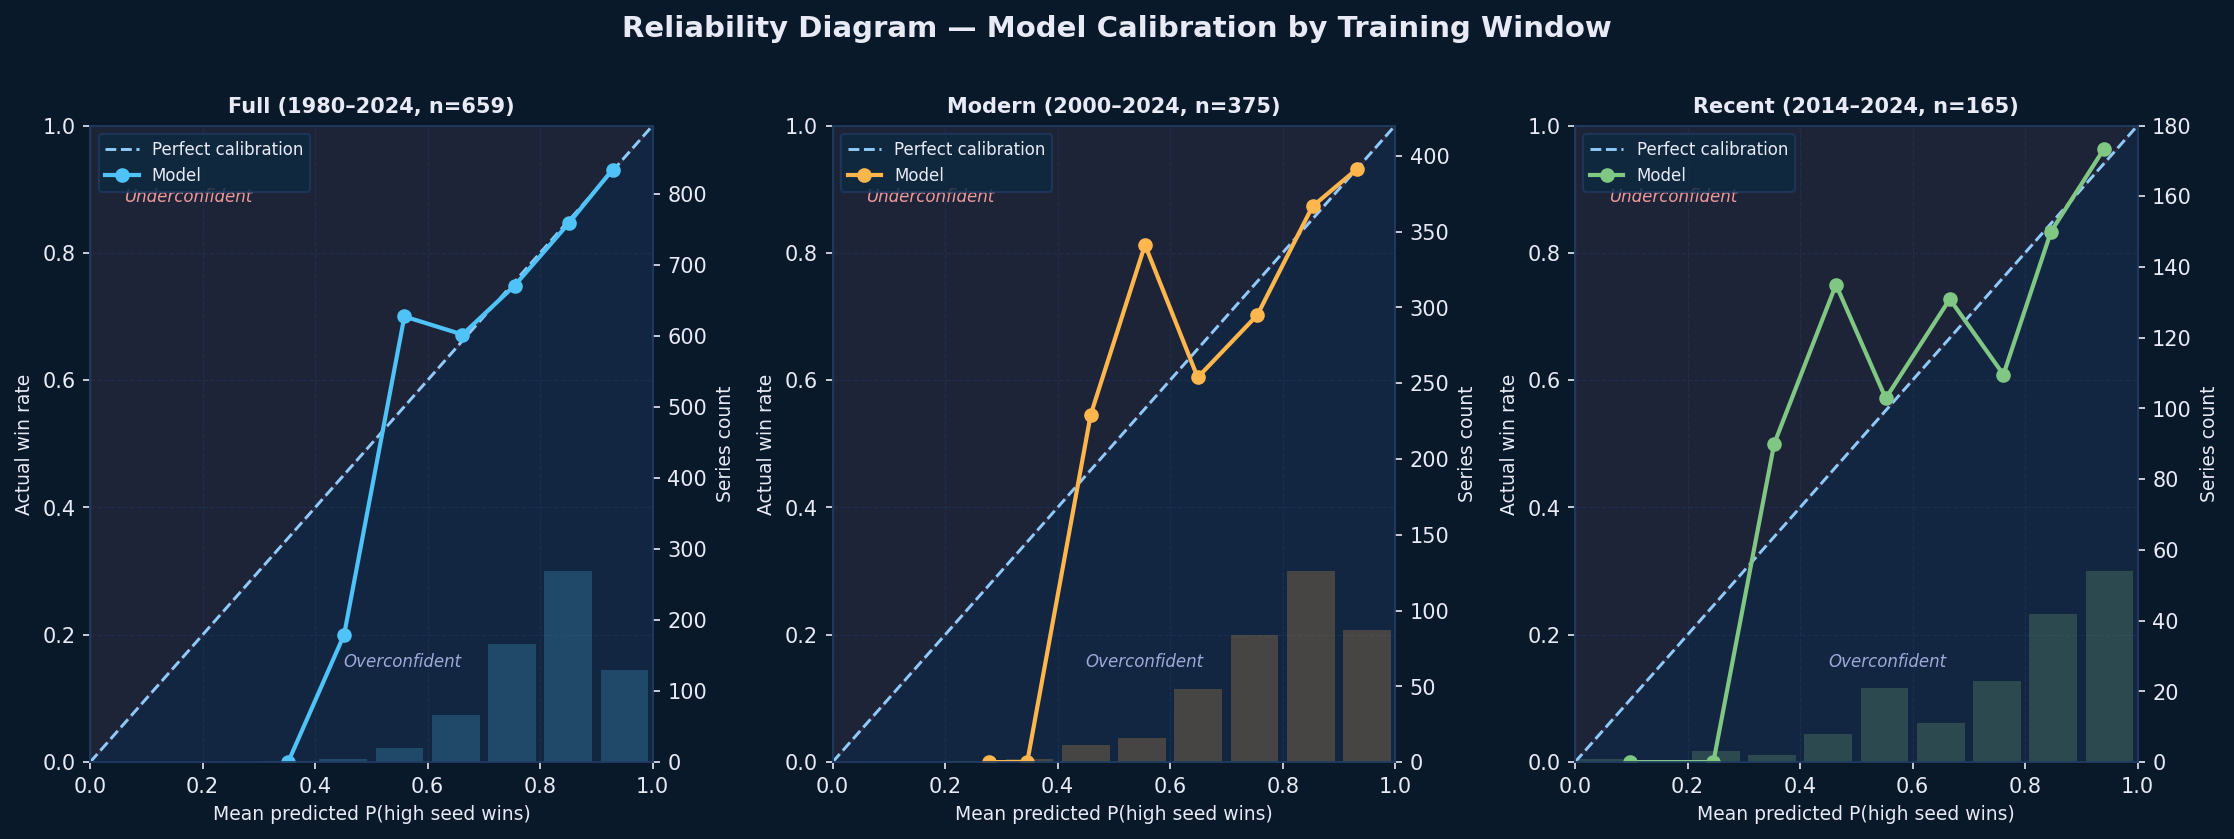
The reliability diagram plots mean predicted probability against actual win rate within equal-width bins of 0.1, separately for each of the three training windows. A perfectly calibrated model follows the diagonal line exactly, meaning that when the model assigns a 70% win probability to the higher seed, the higher seed should win roughly 70% of the time. The histogram at the bottom uses the same bins and shows where predictions are concentrated: almost all series fall between 0.6 and 0.95, confirming the model consistently favors the higher seed and rarely treats a matchup as a coin flip. The empty bars below 0.5 reflect this too, which is consistent with historical base rates.
Across all three windows the model tracks the diagonal closely in the 0.65-0.85 range, where the histogram confirms most series are concentrated, indicating good calibration where it matters most. Deviations appear at the extremes: mild underconfidence above 0.85 where the model is slightly too conservative for the clearest mismatches, and noisier estimates below 0.65 where relatively few series fall. The recent window (n=165) shows more erratic behavior at the extremes due to its smaller sample size, while the full and modern windows are the most stable. Importantly, there is no systematic overconfidence across any window, which is arguably the more dangerous failure mode for a prediction model.
Results
As shown in the table below, the highest overall probability to win the 2026 NBA championship the model assigns to OKC in the full and modern windows, followed by Denver or Detroit in second place and the Celtics coming in third in all windows. Only in the recent window Denver is actually predicted to win it all. The championship probability is calculated by simply dividing the number of simulations in which a specific team wins the NBA title by the total number of simulations. So let's say the Thunder win in 17,500 of the simulations; then their championship probability is 17,500/50,000 = 0.35 (= 35%). The table below shows the exact odds for the top 5 per training window. The odds vary significantly across windows, specifically between the recent window and the other windows. In the recent window the Denver Nuggets are assigned a much higher championship probability, due to the intercept being significantly lower, implying that seeding is less important and team strength is valued more. Additionally, as already mentioned, the championship odds do not reflect the head-to-head matchup predictions which are generally less in favor of Detroit, but the fact that the other Western teams have to face each other (and especially OKC) before the finals drops their championship probabilities significantly.
| Window | 1st 🏆 | 2nd | 3rd | 4th | 5th |
|---|---|---|---|---|---|
| Full 1980–2024 |  OKC 42.0% |  DET 14.6% |  BOS 13.8% |  DEN 12.7% |  SAS 9.9% |
| Modern 2000–2024 | OKC 42.6% | DEN 18.3% | BOS 12.6% | DET 11.5% | SAS 8.0% |
| Recent 2014–2024 | DEN 32.9% | OKC 32.5% | BOS 11.4% |  LAL 6.9% | DET 6.8% |
The frequency of injuries altering the championship outcome is generally low, given the high overall availability of players in the playoffs. However, in several simulations injured stars significantly impact the outcome of the predicted championship probabilities. For example, in exactly 12 out of 50,000 simulations in the modern window, the Nuggets meet the Pistons in the finals and both Jokic and Cade get injured and cannot play. The table below shows the respective model predictions for star injury matchups between Denver and Detroit:
| Cade healthy | Cade injured | |
|---|---|---|
| Jokic healthy | DEN 63.9% / DET 36.1% | DEN 77.7% / DET 22.3% |
| Jokic injured | DEN 27.8% / DET 72.2% | DEN 43.1% / DET 56.9% |
Despite the slightly unfavorable odds in the injury scenario, Denver proceeds to defeat Detroit in 6 out of 12 mentioned scenarios. A more general overview of injury impact is shown below, where the win rate in the finals of the top three teams is compared when their superstar is fully healthy versus when they are injured. Especially the Nuggets see an enormous drop in win rate (-30.0pp) when Jokic is injured due to his absurd BPM of 14.2. This once again showcases the insane impact of an absolute superstar.
| Team | Star BPM | Availability | Finals Appearances | Finals w/ Star Injured | Win Rate (Healthy) | Win Rate (Injured) | Change |
|---|---|---|---|---|---|---|---|
| OKC | 11.7 | 99% | 25,010 | 240 (1.0%) | 85.5% | 62.1% | −23.4pp |
| DEN | 14.2 | 99% | 14,090 | 150 (1.1%) | 65.4% | 35.3% | −30.0pp |
| DET | 6.3 | 85% | 19,773 | 3,026 (15.3%) | 30.4% | 21.8% | −8.6pp |
Note also that Detroit's star availability is only 85%. This is because the star players that do not have historical playoff experience get assigned the league average fallback percentage of 85%. Meaning stars such as Cade Cunningham and Victor Wembanyama will have a relatively low playoff availability percentage. To account for this issue I ran a simulation using full health for all players to see the impact. The below table shows the results for the modern window. As expected the championship odds for the Spurs and Pistons increase, because of their initial low availability, whereas the odds for the other "healthy" teams drop accordingly.
| Team | Baseline Odds | Fully Healthy Odds | Change |
|---|---|---|---|
| OKC | 42.6% | 41.0% | −1.6pp |
| DEN | 18.3% | 16.2% | −2.2pp |
| DET | 11.5% | 15.0% | +3.5pp |
| BOS | 12.6% | 11.0% | −1.6pp |
| SAS | 8.0% | 9.9% | +1.9pp |
Lastly, to all Phoenix fans out there, do not despair (yet)! In exactly 1 out of 50,000 simulations (0.002%) the Suns end up winning it all (both modern and full window). So with a little bit (read: an obscene amount) of luck, you walk away finally an NBA champion.
Please feel free to reach out in case you have questions or suggestions.
Thank you!
contact: stikkelanalytics@gmail.com